KPI dashboards - overview
Summary
The KPI dashboards enable you to create tailor made real time dashboards of information in the Service Connect system.
Separate dashboards can be set up by contract, work stream or team or for the whole organisation.
At the moment the KPI dashboards work for:
Sales order data
Visit and appointment data
Setting up a dashboard
When you first start with the KPIs you get a blank screen:
Step 1 - use the pencil icon to create the main navigation
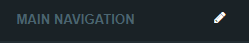
This allows you to define the main Groups and Boards within a Group
You can re-sequence the Groups and Boards within a Group by dragging and dropping. Hold the mouse key on the icon and you can change the sequence by dragging up or down.
Step 2 - use the update icon to add a new widget to the dashboard
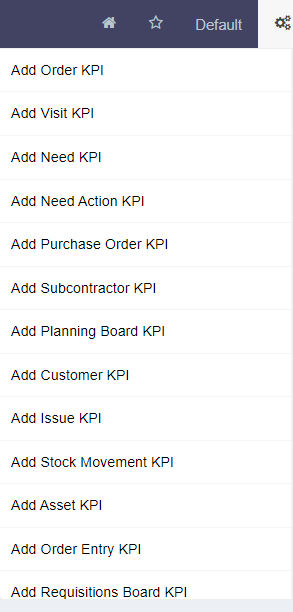
A new widget is created for editing
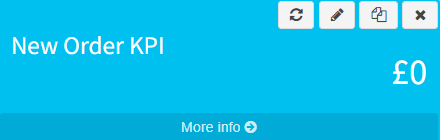
You can now edit the widget to calculate the information you require
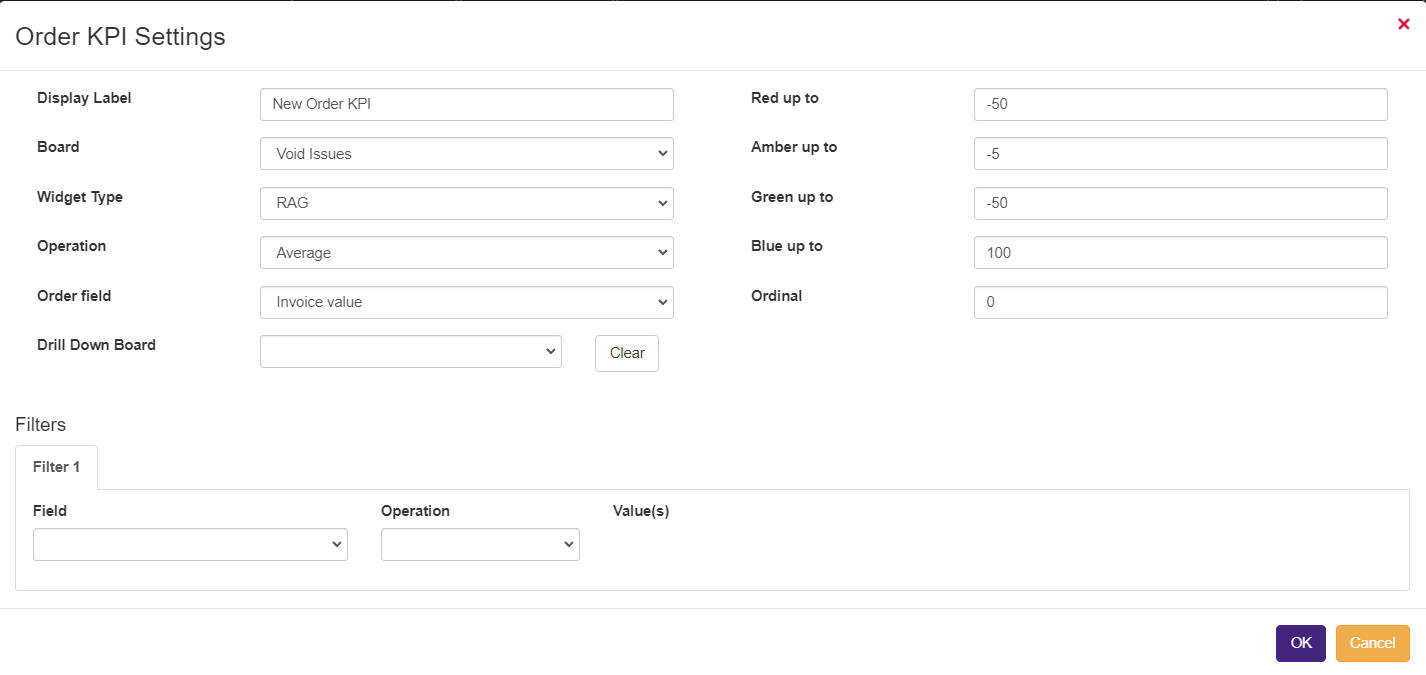
Step 3 - Select the widget parameters
The fields are as follows:
|
Field |
Description |
|---|---|
|
Display label |
The label displayed on the screen |
|
Board |
The board the widget appears on |
|
Widget type |
The type of widget. At the moment this is either a RAG status or a bar chart. |
|
Operation |
The overall operation - Sum, Average or Count |
|
Field |
Which field is being analysed (if you have chosen count the field to analyse is not relevant |
|
Filters |
How should the data be filtered for this calculation e.g. contract, statuses, priorities etc. |
Other features
Any recent board that you have visited are list on the bottom of the left hand panel
If you press the start icon the board is set as your home board. This means this is the first board that you will see when you select the KPIs option.